Fig. 3
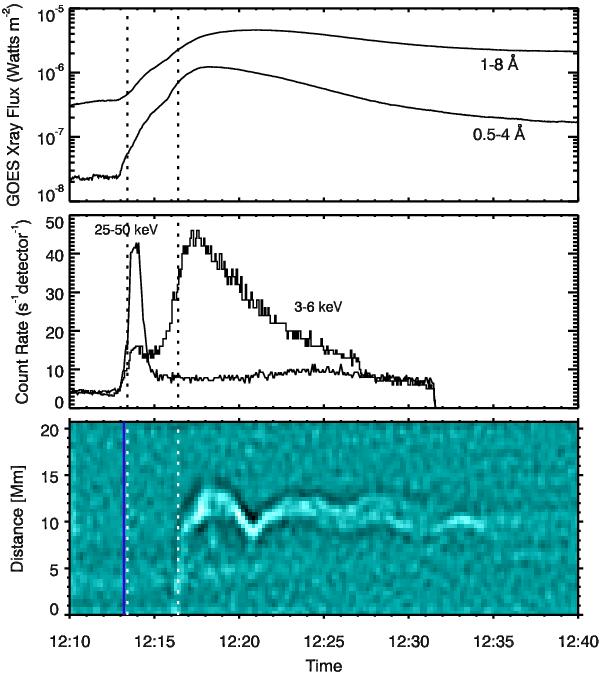
Upper: GOES (1–8 and 0.5–4 Å) soft X-ray flux. Middle: RHESSI (3–6 and 25–50 keV) X-ray flux. The 25–50 keV curve has been scaled by 0.25. Lower: an example time-distance cut of the 131 Å loop oscillation. Times of different events are indicated. Blue solid line: approximate start of CME eruption at 12:13:21 UT. Dotted lines indicate the reference times of the oscillations, 12:13:36 UT for the 171 Å loops from White & Verwichte (2012) and 12:16:33 UT for the 131 Å loop.
Current usage metrics show cumulative count of Article Views (full-text article views including HTML views, PDF and ePub downloads, according to the available data) and Abstracts Views on Vision4Press platform.
Data correspond to usage on the plateform after 2015. The current usage metrics is available 48-96 hours after online publication and is updated daily on week days.
Initial download of the metrics may take a while.