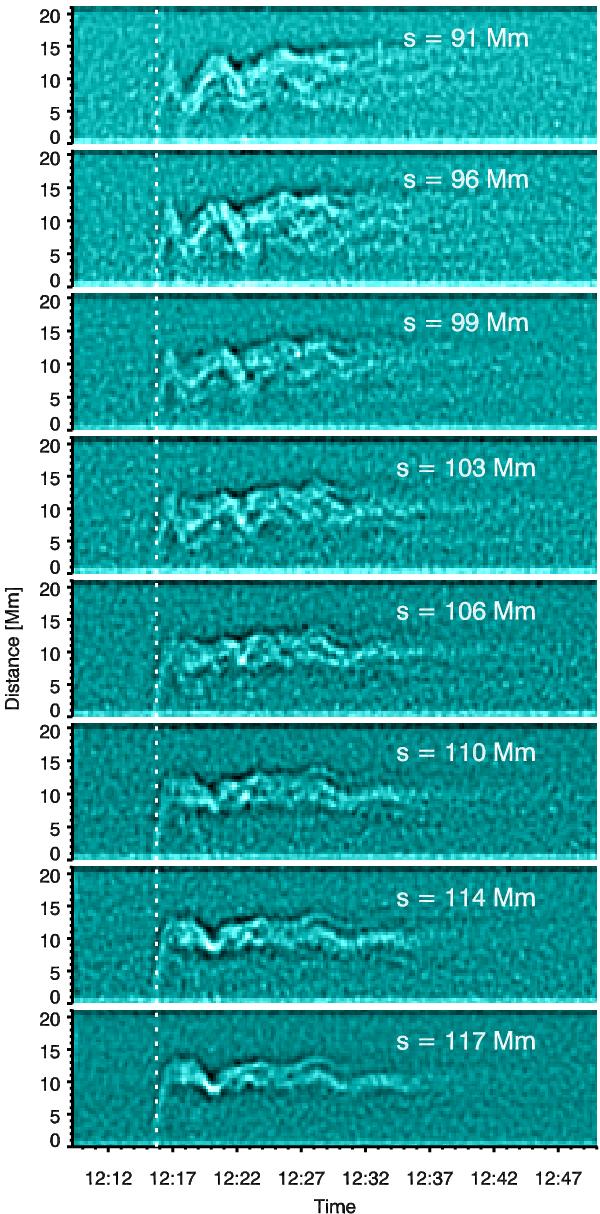
Fig. 2

Time-distance images extracted from cuts taken along the loop to analyse the oscillation. The cuts span the region where it is expected a node lies. The loop oscillations are observed to undergo a 180° shift in phase in the region between s = 103 and s = 114 Mm. The vertical dotted line indicates the reference time of 12:16:33 UT.
Current usage metrics show cumulative count of Article Views (full-text article views including HTML views, PDF and ePub downloads, according to the available data) and Abstracts Views on Vision4Press platform.
Data correspond to usage on the plateform after 2015. The current usage metrics is available 48-96 hours after online publication and is updated daily on week days.
Initial download of the metrics may take a while.


