Fig. 1
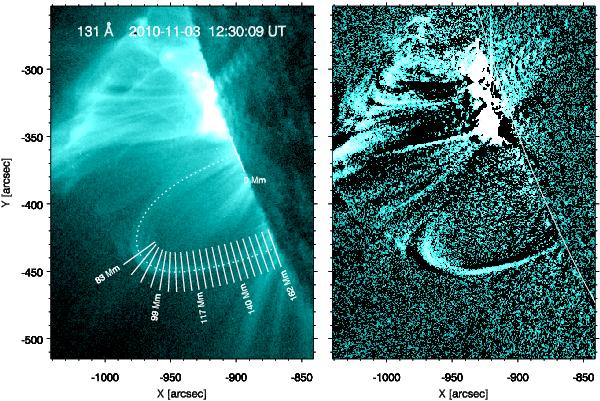
AIA/SDO 131 Å image of the November 3 event. Left: image of the event outlining the position of the hot loop below the CME ejecta. Cuts taken to analyse the oscillation are displayed and are separated by ~4 Mm. The distance co-ordinate s begins at the top leg and ends at the bottom leg. Right: a difference image highlighting the loop oscillation, which was produced by subtracting the image taken at 12:20:57 from the one at 12:22:57 UT. The solar limb is indicated by the solid white line.
Current usage metrics show cumulative count of Article Views (full-text article views including HTML views, PDF and ePub downloads, according to the available data) and Abstracts Views on Vision4Press platform.
Data correspond to usage on the plateform after 2015. The current usage metrics is available 48-96 hours after online publication and is updated daily on week days.
Initial download of the metrics may take a while.