Fig. 3
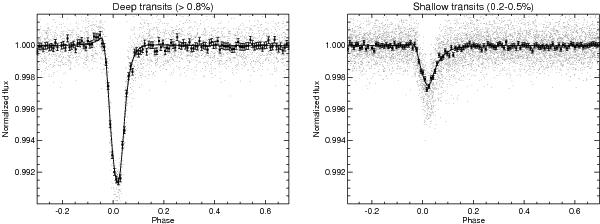
Light curves of KIC 1255b, obtained by dividing the events into two groups based on their transit depths and binning the photometry by 0.008 in phase. The left panel shows the average light curve of the deep events (deeper than 0.8%), and the right panel shows the average light curve of the shallow events (depths between 0.2% and 0.5%). The best-fit models for the two light curves are shown as a solid line.
Current usage metrics show cumulative count of Article Views (full-text article views including HTML views, PDF and ePub downloads, according to the available data) and Abstracts Views on Vision4Press platform.
Data correspond to usage on the plateform after 2015. The current usage metrics is available 48-96 hours after online publication and is updated daily on week days.
Initial download of the metrics may take a while.