Free Access
Fig. 2
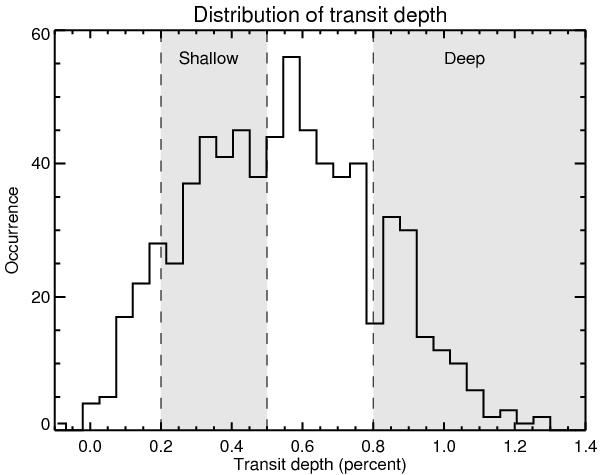
Distribution of the transit depths, as measured by fitting the Kepler photometry with our model light curve with all parameters but the transit depth fixed to the best-fit values. Orbits that don’t sample the in-transit portion of the curve are discarded.
Current usage metrics show cumulative count of Article Views (full-text article views including HTML views, PDF and ePub downloads, according to the available data) and Abstracts Views on Vision4Press platform.
Data correspond to usage on the plateform after 2015. The current usage metrics is available 48-96 hours after online publication and is updated daily on week days.
Initial download of the metrics may take a while.