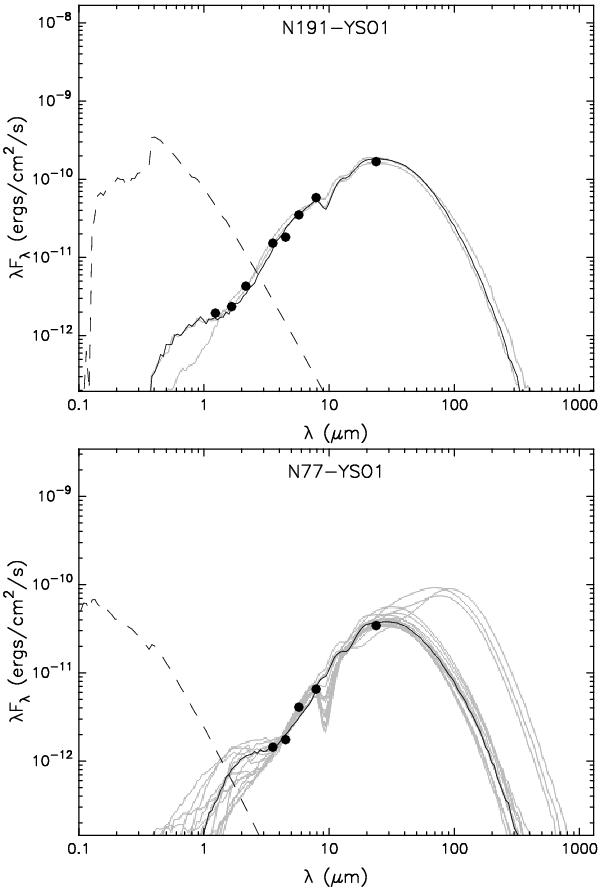
Fig. 8

Mid-IR Spitzer photometry of two YSOs fitted using YSO models (Robitaille et al. 2007). The filled circles represent the input fluxes. The black curve shows the best fit, while the gray curves display subsequent good fits. The dashed curve shows the stellar photosphere corresponding to the central source of the best-fitting model, as it would look in the absence of circumstellar dust (but including interstellar extinction). Upper panel: SED fit of N191-YSO1. The stellar mass according to these models varies between 16 and 21 M⊙. The best fit is for a 20 M⊙ protostar with a derived total luminosity of 2.9 × 10⁴ L⊙. Lower panel: SED fit of N77-YSO1. The stellar mass according to these models varies between 10 and 17 M⊙. Note that the lack of JHK photometry leads to a wider range of selected models. The best fit is for a 10 M⊙ protostar with a derived total luminosity of 1.0 × 10⁴ L⊙.
Current usage metrics show cumulative count of Article Views (full-text article views including HTML views, PDF and ePub downloads, according to the available data) and Abstracts Views on Vision4Press platform.
Data correspond to usage on the plateform after 2015. The current usage metrics is available 48-96 hours after online publication and is updated daily on week days.
Initial download of the metrics may take a while.


