Fig. 6
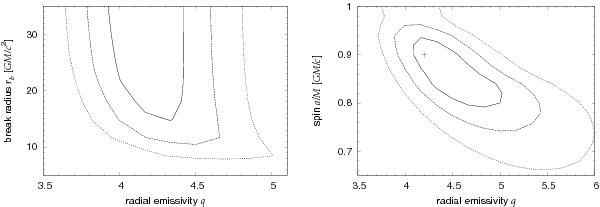
Contour plots of the radial emissivity parameter q and the break radius rb (left) and the spin a (right), respectively. Data were created by a “complex” model with radially stratified ionisation, isotropic irradiation, and angular emissivity. A single-ionisation model with power-law radial emissivity was used to fit the data. The individual contours correspond to 1σ, 2σ, and 3σ level, respectively.
Current usage metrics show cumulative count of Article Views (full-text article views including HTML views, PDF and ePub downloads, according to the available data) and Abstracts Views on Vision4Press platform.
Data correspond to usage on the plateform after 2015. The current usage metrics is available 48-96 hours after online publication and is updated daily on week days.
Initial download of the metrics may take a while.