Fig. 4
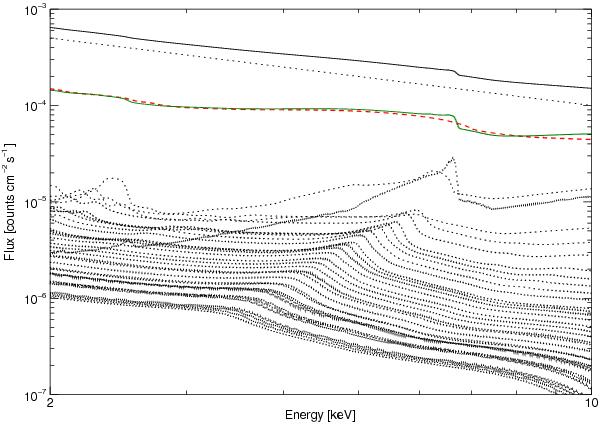
Plot of the “complex” model. The top solid line shows the total model flux, while the dotted lines are its components. The sum of all reflection components is shown by the green solid line. The red dashed line represents the best-fit reflection model assuming single ionisation. See the main text for more details.
Current usage metrics show cumulative count of Article Views (full-text article views including HTML views, PDF and ePub downloads, according to the available data) and Abstracts Views on Vision4Press platform.
Data correspond to usage on the plateform after 2015. The current usage metrics is available 48-96 hours after online publication and is updated daily on week days.
Initial download of the metrics may take a while.