Fig. 7
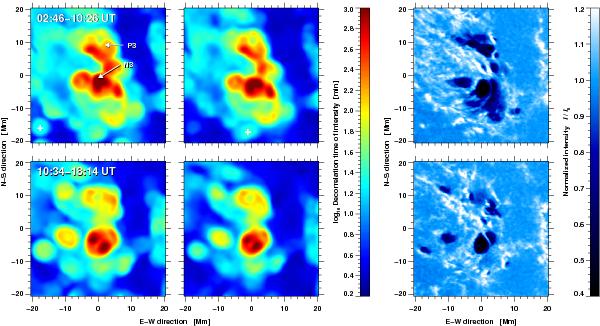
Decorrelation times computed using the linear Pearson (left) and Spearman’s rank order (middle) correlation coefficients for the intensity of G-band images. The time-series was divided into two parts, from 02:46–10:26 UT (top) and 10:34–18:14 UT (bottom). Average G-band images for these time intervals (right) clearly show the penumbral decay of the satellite sunspot.
Current usage metrics show cumulative count of Article Views (full-text article views including HTML views, PDF and ePub downloads, according to the available data) and Abstracts Views on Vision4Press platform.
Data correspond to usage on the plateform after 2015. The current usage metrics is available 48-96 hours after online publication and is updated daily on week days.
Initial download of the metrics may take a while.