Fig. 2
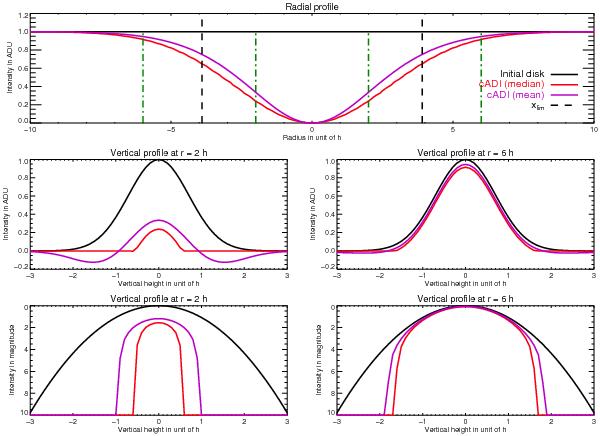
Top: radial intensity profile along the disk mid-plane of the initial disk (black) and cADI images (reference frame built by median-combination in red and by mean-combination in purple). Middle: two vertical intensity profiles at the radii corresponding to the green dashed lines of the top figure, in linear scale. Bottom: same vertical profiles in magnitude scale.
Current usage metrics show cumulative count of Article Views (full-text article views including HTML views, PDF and ePub downloads, according to the available data) and Abstracts Views on Vision4Press platform.
Data correspond to usage on the plateform after 2015. The current usage metrics is available 48-96 hours after online publication and is updated daily on week days.
Initial download of the metrics may take a while.