Fig. 3
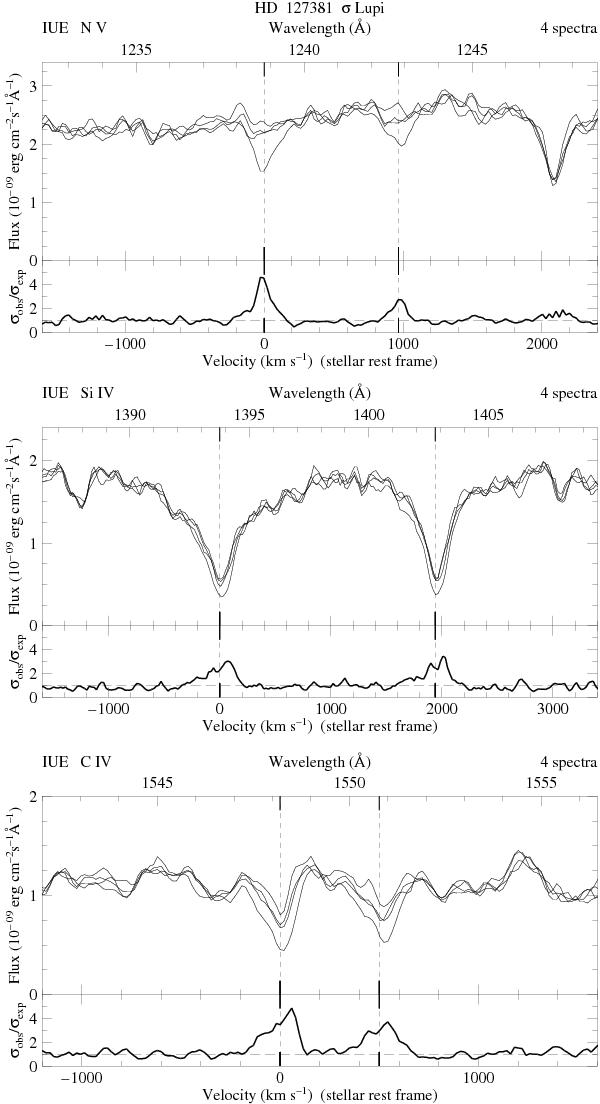
Overplot of the four selected profiles of N v (top), Si iv (middle), and C iv (bottom) of σ Lup. The two doublet rest wavelengths are indicated by vertical dashed lines. Top scale: wavelength. Bottom scale: velocity with respect to the stellar rest frame. In each panel the lower part displays the significance of the variability, expressed as the square root of the ratio of the measured to the expected variances. The changes are very similar to what is observed in known magnetic B stars (see Fig. 1), but not in other B stars.
Current usage metrics show cumulative count of Article Views (full-text article views including HTML views, PDF and ePub downloads, according to the available data) and Abstracts Views on Vision4Press platform.
Data correspond to usage on the plateform after 2015. The current usage metrics is available 48-96 hours after online publication and is updated daily on week days.
Initial download of the metrics may take a while.