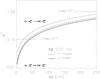
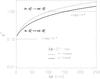
Fig. 5
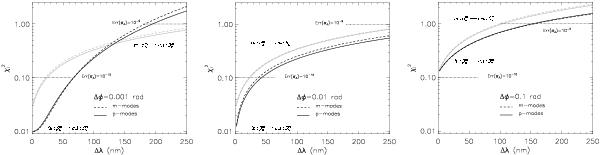
 values as a function of the wavelength bandpass and a phase-mask with a 10-1/10-2/10-3 radian of phase-shift error. The black lines correspond to for the in:
  :
:  retrieval, the gray lines are for the in:
  : retrieval: the solid lines are for the “p” modes and the dashed lines are for the “m” modes. The x and y scales are common between the three images. The values for of 10-2 rad for the mask error are poorer than in the previous simulations. The 10-1 rad case presents significant limitations because of a strong peak in the image center (β0,0 = 0.04). The dotted line with
  and
and  shows the chromatic limit of a desired retrieval precision in the “AO metric”.
Current usage metrics show cumulative count of Article Views (full-text article views including HTML views, PDF and ePub downloads, according to the available data) and Abstracts Views on Vision4Press platform.
Data correspond to usage on the plateform after 2015. The current usage metrics is available 48-96 hours after online publication and is updated daily on week days.
Initial download of the metrics may take a while.