Fig. Q.2
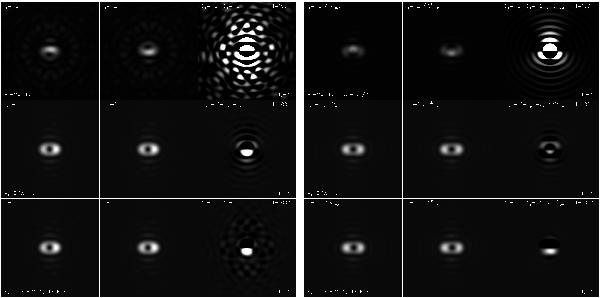
Set of numerical monochromatic coronagraphic simulations with a vortex mask error of 0.001 radian. The input sin frequency is chosen as fx = 2 (low-order wavefront error). Each graphic is organized as follows: Left to right: lp = + 2 coronagraphic image, lp = −2 coronagraphic image, difference between the two previous images with an amplification of intensity level of 100. Upper: pure amplitude wavefront error (Aa = 0.01), middle: pure phase error (AΦ = 0.1λ0), and bottom: both errors, amplitude and phase. The first nine sets of figures left is for the FFT propagation, whereas the nine sets of figures right is for direct  modal decomposition. The brightness scales are linear and are the same for the FFT and the NZ images sets. We notice that the amplitude modulation effects on the final coronagraphic images (three upper images) are smaller than the phase modulation error and the brightness scales for the amplitude set of simulations are also smaller to enhance the image contrast. Indeed, for the amplitude error, we chose 10-7 ≤ I ≤ 10-5 and for the phase error 10-5 ≤ I ≤ 2.5 × 10⁻⁴. The direct comparison between the FFT and NZ shows a very significant similarity in the direct images lp = ± 2 and after substraction of the two images.
Current usage metrics show cumulative count of Article Views (full-text article views including HTML views, PDF and ePub downloads, according to the available data) and Abstracts Views on Vision4Press platform.
Data correspond to usage on the plateform after 2015. The current usage metrics is available 48-96 hours after online publication and is updated daily on week days.
Initial download of the metrics may take a while.