Fig. K.1
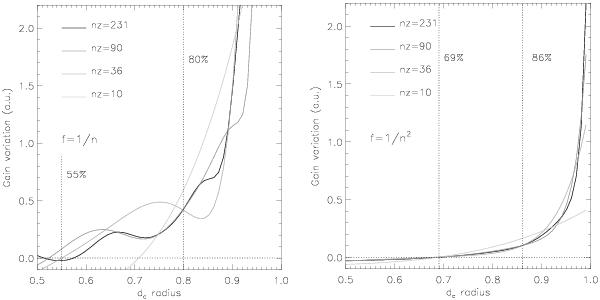
Variation of the residual energy (dEp/dx) in the residual optical aberrations as a function of the number of Zernike polynomials used (nz – without the piston term) and the power spectral density 1/npw. The figure shows two diaphragm values: when the gain is maximum and when it is equal to zero. The figure in 1/n presents strong residual oscillations owing to low-order aberrations.
Current usage metrics show cumulative count of Article Views (full-text article views including HTML views, PDF and ePub downloads, according to the available data) and Abstracts Views on Vision4Press platform.
Data correspond to usage on the plateform after 2015. The current usage metrics is available 48-96 hours after online publication and is updated daily on week days.
Initial download of the metrics may take a while.