Fig. 4
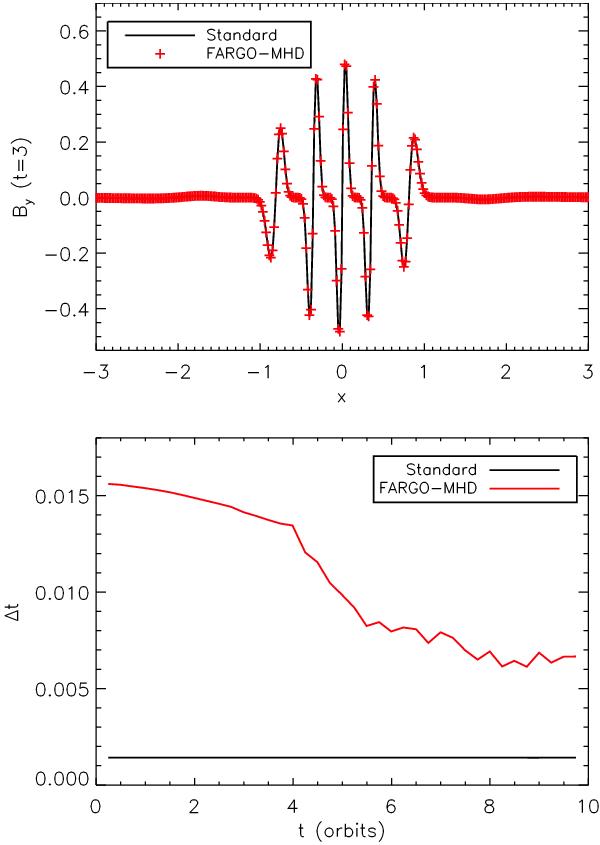
Top panel: horizontal cuts at y = 0 of the y component of magnetic field at t = 3 for the MHD vortex test in cartesian coordinates using the standard integration method (solid line) and FARGO-MHD (plus signs). Bottom panel: time-step variation during the computation. Solid and dashed lines correspond to standard and FARGO-MHD computations, respectively.
Current usage metrics show cumulative count of Article Views (full-text article views including HTML views, PDF and ePub downloads, according to the available data) and Abstracts Views on Vision4Press platform.
Data correspond to usage on the plateform after 2015. The current usage metrics is available 48-96 hours after online publication and is updated daily on week days.
Initial download of the metrics may take a while.