Fig. 2
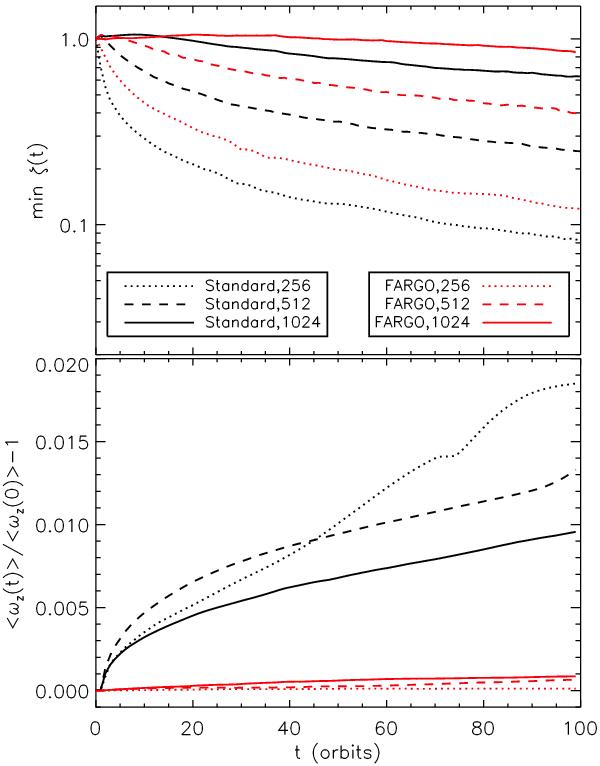
Time evolution of the vortensity minimum (top, normalized to its initial value) and relative variation in the total integrated vorticity  (bottom) for the hydrodynamical vortex problem. Dotted, dashed, and solid lines refer to computations obtained at the resolutions of 256 × 1024, 512 × 2048, and 1024 × 4096 grid zones, respectively. Black and red colors correspond to the the standard integration algorithm and FARGO-MHD, respectively.
Current usage metrics show cumulative count of Article Views (full-text article views including HTML views, PDF and ePub downloads, according to the available data) and Abstracts Views on Vision4Press platform.
Data correspond to usage on the plateform after 2015. The current usage metrics is available 48-96 hours after online publication and is updated daily on week days.
Initial download of the metrics may take a while.