Fig. A.1
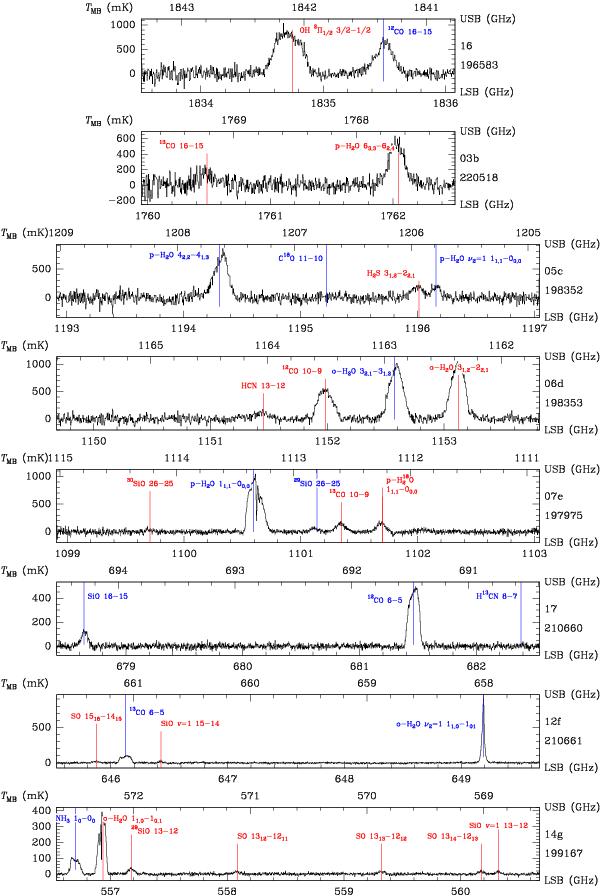
Full wide-band spectrometer spectra obtained towards NML Cyg. The setting number is indicated on the right side. Each spectrum is displayed on a double-side-band scale with both side-band frequency scales drawn. The spectral resolution is the native one (1.1 MHz), and low-order polynomial baselines have been subtracted. Lines are indicated with the respective ticks at the expected (velocity-corrected) frequency – lines from the USB have their ticks pointing upwards, while lines from the LSB have ticks pointing downwards. The spectrum in setting 16 is made of only a fraction of the data taken at this frequency, for the purpose of standing wave mitigation (see text for details). The obsid’s numbers are given below the setting number, in the form of 1342 × , “ × ” being the identifier indicated on the plot.
Current usage metrics show cumulative count of Article Views (full-text article views including HTML views, PDF and ePub downloads, according to the available data) and Abstracts Views on Vision4Press platform.
Data correspond to usage on the plateform after 2015. The current usage metrics is available 48-96 hours after online publication and is updated daily on week days.
Initial download of the metrics may take a while.