Fig. 9
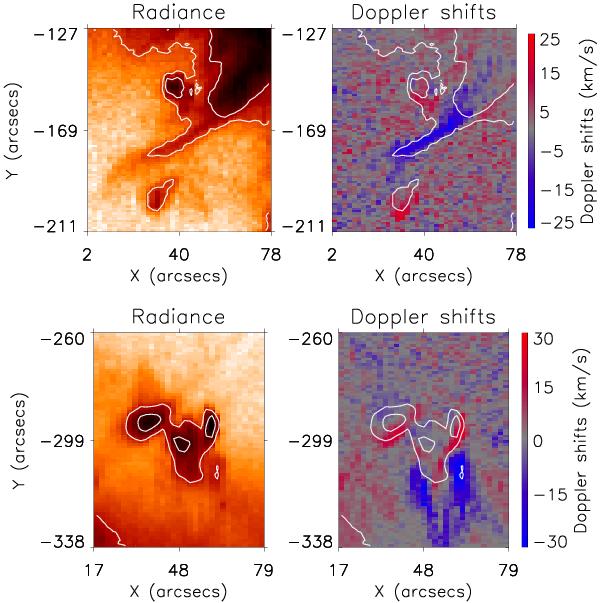
Two examples, brightening event 3 at coronal hole boundaties (top) and 1 in coronal hole (bottom), observed on November 12. The left and right panels represent the Fe xii 195 Å intensity and Doppler shift images, respectively. Event 3 was scanned between 01:17 UT and 01:54 UT while event 1 between 01:17 UT and 01:49 UT during the big raster observations. The top event happened at the coronal hole boundary while the bottom inside the coronal hole.
Current usage metrics show cumulative count of Article Views (full-text article views including HTML views, PDF and ePub downloads, according to the available data) and Abstracts Views on Vision4Press platform.
Data correspond to usage on the plateform after 2015. The current usage metrics is available 48-96 hours after online publication and is updated daily on week days.
Initial download of the metrics may take a while.