Free Access
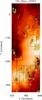
Fig. 3
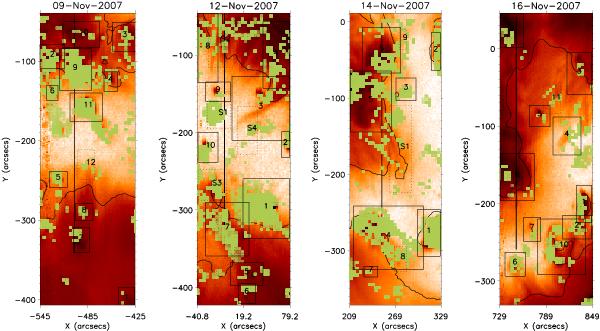
EIS large rasters with the identified events overplotted with solid line boxes. The dashed line boxes indicate the events identified in the small rasters. The overplotted symbols show the pixels identified with a brightening enhancement in the XRT data from Paper II.
This figure is made of several images, please see below:
Current usage metrics show cumulative count of Article Views (full-text article views including HTML views, PDF and ePub downloads, according to the available data) and Abstracts Views on Vision4Press platform.
Data correspond to usage on the plateform after 2015. The current usage metrics is available 48-96 hours after online publication and is updated daily on week days.
Initial download of the metrics may take a while.