Fig. A.2
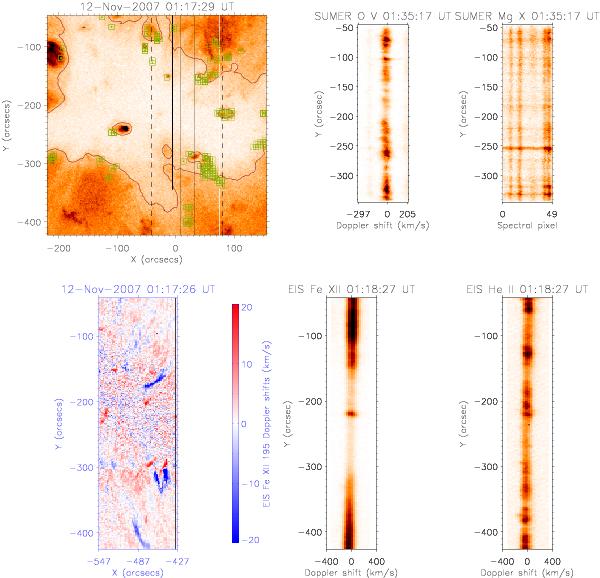
Animation of co-temporal images of the coronal hole dataset on November 12 including at the top XRT images with the EIS big raster FOV overplotted with dashed lines, the EIS small raster with solid long lines and the SUMER slit position with solid short line at the given time, and intensity of SUMER O v 1259.54 Å and SUMER Mg x 1249.90 Å windows. The overplotted white line represents the EIS slit position at the given time. Bottom from left to right: EIS Doppler maps, Fe xii 195.12 Å, and He ii 256.32 Å intensity along the slit at the given time.
Current usage metrics show cumulative count of Article Views (full-text article views including HTML views, PDF and ePub downloads, according to the available data) and Abstracts Views on Vision4Press platform.
Data correspond to usage on the plateform after 2015. The current usage metrics is available 48-96 hours after online publication and is updated daily on week days.
Initial download of the metrics may take a while.