Fig. 7
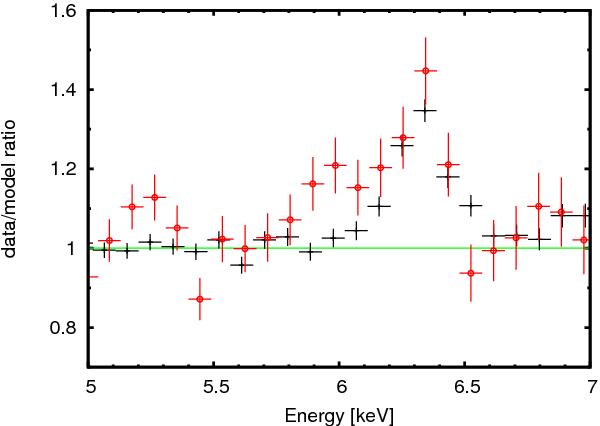
Spectral residuals in the iron line energy range. The residuals are calculated against model consisting of power law with the partially covering absorber. Black data points correspond to the spectra of front-illuminated Suzaku/XIS detectors. The red ones (with small circles) correspond to EPIC-pn spectrum. The data are binned for plotting purposes only.
Current usage metrics show cumulative count of Article Views (full-text article views including HTML views, PDF and ePub downloads, according to the available data) and Abstracts Views on Vision4Press platform.
Data correspond to usage on the plateform after 2015. The current usage metrics is available 48-96 hours after online publication and is updated daily on week days.
Initial download of the metrics may take a while.