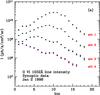
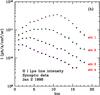
Fig. 3
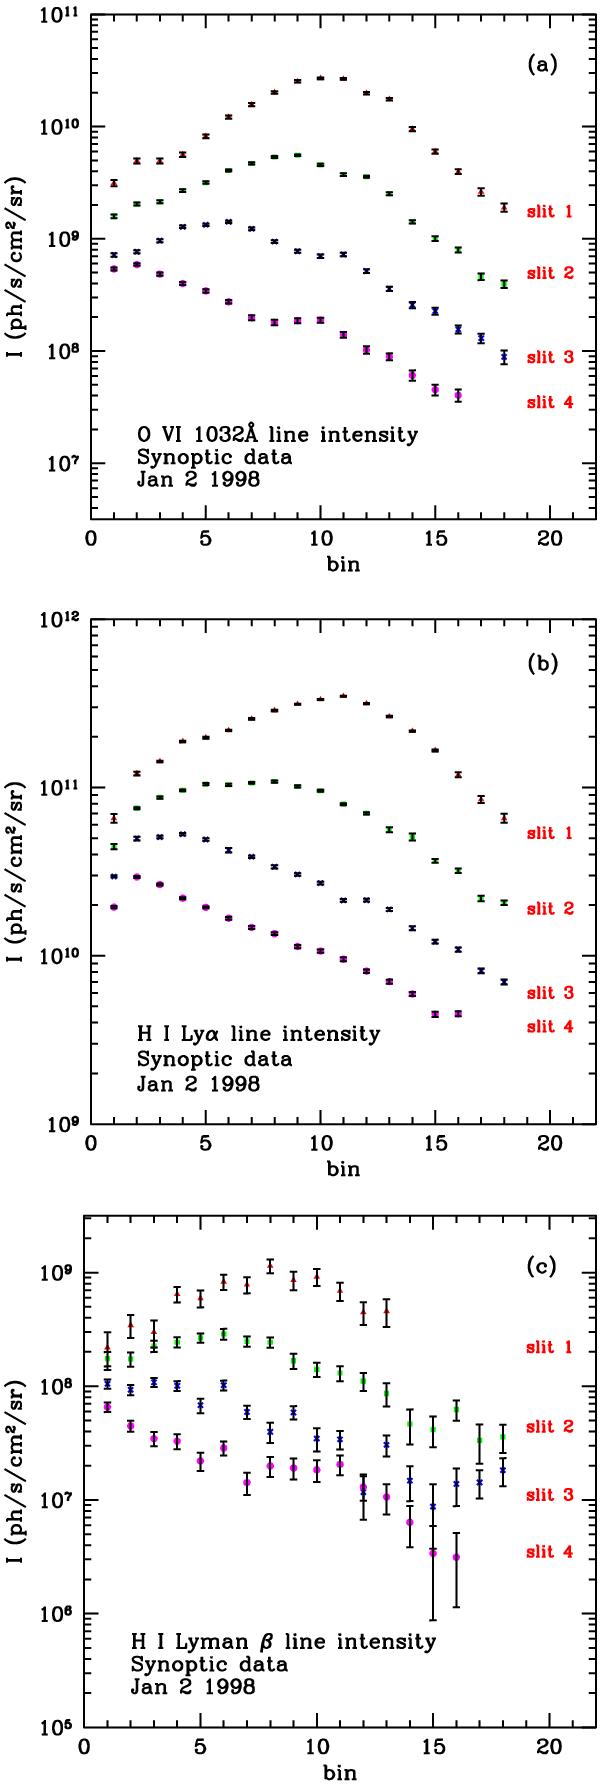
Panel a) O vi 1031.9 Å line intensities along the UVCS slit at the four altitudes where the UVCS slit was set. The spatial bin values increase along the southward direction. We show only data in bins 1 to 18 for the first three slits and from 1 to 16 for the fourth. Panel b) same as panel a) for the H i Lyα line. Panel c) same as panel a) for the H i Lyβ line, except in the first slit, where data were considered only up to bin 13. Intensities are given in ph/s/cm2/sr.
Current usage metrics show cumulative count of Article Views (full-text article views including HTML views, PDF and ePub downloads, according to the available data) and Abstracts Views on Vision4Press platform.
Data correspond to usage on the plateform after 2015. The current usage metrics is available 48-96 hours after online publication and is updated daily on week days.
Initial download of the metrics may take a while.