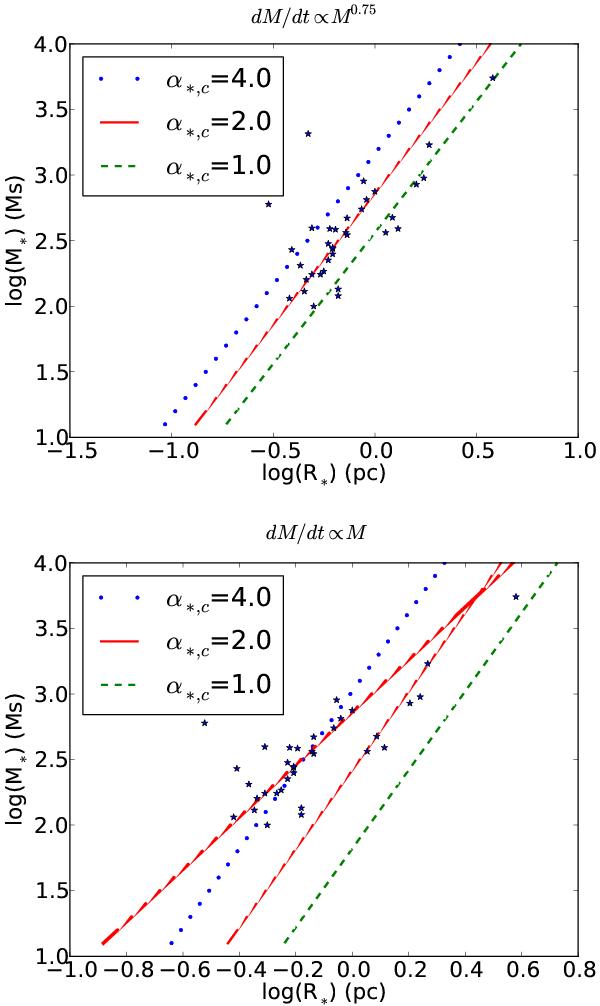
Fig. 2

Upper panel: mass of the cluster as a function of its radius as predicted by Eq. (12), i.e. for a turbulent type accretion for which Ṁ ∝ M0.75. Three values of α∗,c are displayed. The stars correspond to the embedded clusters listed in Table 1 of Lada & Lada (2003) for which the mass has been multiplied by 5 to account for a star formation efficiency of about 20%. Lower panel: same as lower panel for Ṁ ∝ M. The thick solid line corresponds to the solid line of the upper panel for comparison.
Current usage metrics show cumulative count of Article Views (full-text article views including HTML views, PDF and ePub downloads, according to the available data) and Abstracts Views on Vision4Press platform.
Data correspond to usage on the plateform after 2015. The current usage metrics is available 48-96 hours after online publication and is updated daily on week days.
Initial download of the metrics may take a while.


