Free Access
Fig. 16
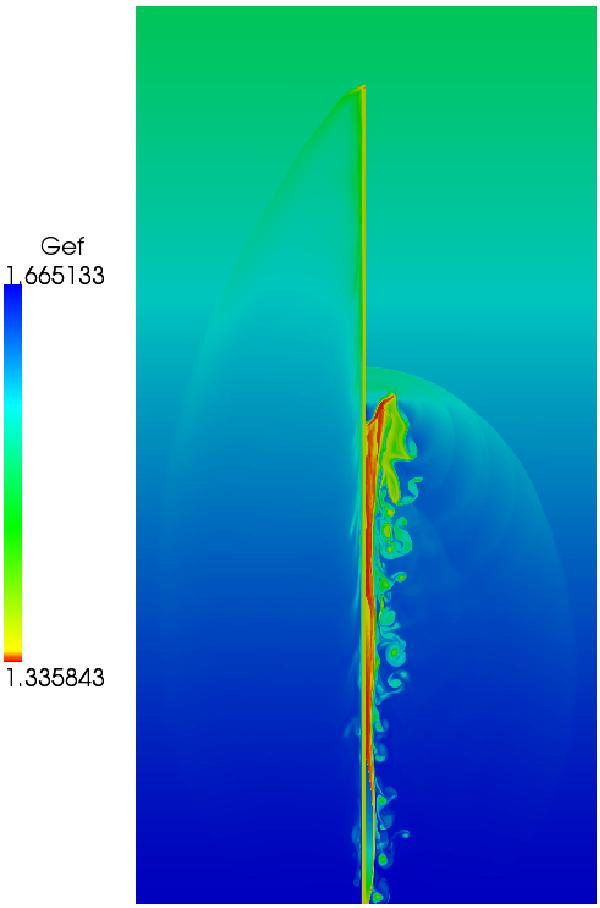
Comparison of the effective polytropic index for cases C (left) and E (right) at time 20 of the simulation. This figure reveals more clearly a series of secondary shocks that propagate in the shocked ISM region and also reheat it.
Current usage metrics show cumulative count of Article Views (full-text article views including HTML views, PDF and ePub downloads, according to the available data) and Abstracts Views on Vision4Press platform.
Data correspond to usage on the plateform after 2015. The current usage metrics is available 48-96 hours after online publication and is updated daily on week days.
Initial download of the metrics may take a while.