Free Access
Fig. 3
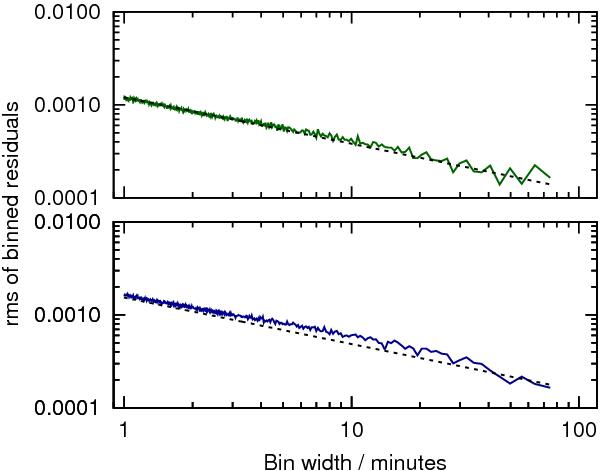
The rms of the binned residuals for the Spitzer data at 3.6 μm (upper) and 4.5 μm (lower) (solid lines). The white-noise expectation, where the rms decreases in proportion to the square root of the bin size, is indicated by the dashed line in each panel.
Current usage metrics show cumulative count of Article Views (full-text article views including HTML views, PDF and ePub downloads, according to the available data) and Abstracts Views on Vision4Press platform.
Data correspond to usage on the plateform after 2015. The current usage metrics is available 48-96 hours after online publication and is updated daily on week days.
Initial download of the metrics may take a while.