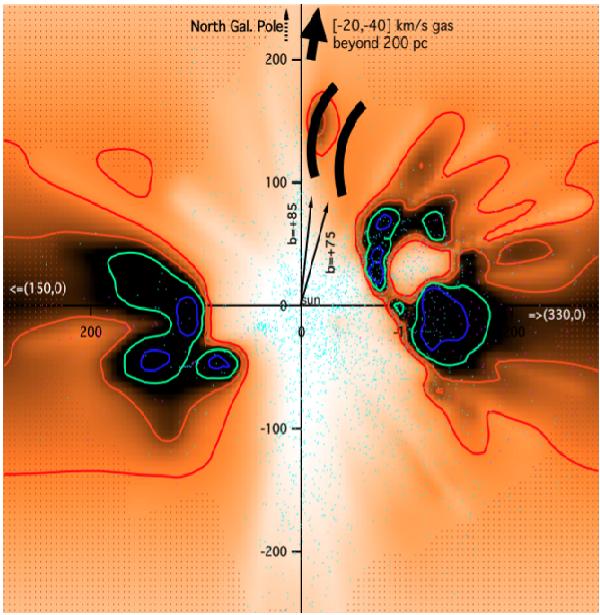
Fig. 7

Locations of the HI arches detected in absorption w.r.t. the local ISM global structure, drawn as thick black curve lines. The map represents a planar cut through the 3D opacity distribution derived by 37 from extinction data. The Sun is at the center (0, 0 coordinates) and the north pole is directed to the top of the figure. The plane is oriented along the 150–330° longitude direction. Units are parsecs. Black represents high-opacity regions, white non-reddening medium. The spatial resolution of the map is 15 pc (see Vergely et al., for explanations). Iso-opacity contours have been added to emphasize the dense areas. Turquoise and green small dots are the stars close to the plane included in the inverted dataset and their distribution gives an idea of the constraints on the gas location. Pale dots indicate regions where no inversion was made due to insufficient data. The –1 below the plane on the right is the first digit of the –100 pc label (X counted positively toward the anticenter). We have represented the two arches detected in this plane, i.e., toward b = + 85 and + 75°. The first arch falls close to the dust cloud found by inversion of extinction data. The lower velocity gas is indicated by arrows pointing to longer distances. The cavity towards l,b = (330°, +20°) was very likely blown by stars from the Upper-Scorpius OB association. Interestingly, the HI gas here located falls in the continuity of the masses of dust, whose boundaries defining the local chimney are inclined w.r.t. to the polar axis.
Current usage metrics show cumulative count of Article Views (full-text article views including HTML views, PDF and ePub downloads, according to the available data) and Abstracts Views on Vision4Press platform.
Data correspond to usage on the plateform after 2015. The current usage metrics is available 48-96 hours after online publication and is updated daily on week days.
Initial download of the metrics may take a while.


