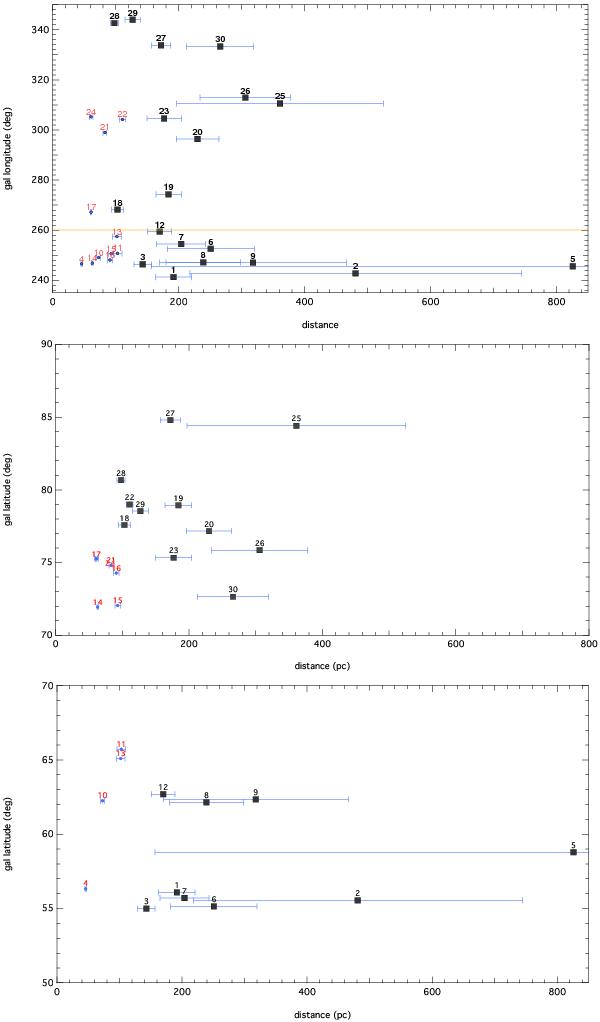
Fig. 4

Distribution of the target stars in longitude vs. distance (top) and latitude vs. distance (middle for b ≥ 70° and bottom for b ≤ 70°). The stars have been divided into two groups, according their latitudes (see text). In the top graph, the two groups of stars are separated by a yellow line, except for the three targets 14 to 16 that are at low longitudes but seem to be located in the direction of the high-latitude arch. The red (resp. black) numbers show the target star without (resp. with) interstellar sodium lines at radial velocities identical to the HI loop I radio velocities. The stars with interstellar lines are also shown with rectangular symbols.
Current usage metrics show cumulative count of Article Views (full-text article views including HTML views, PDF and ePub downloads, according to the available data) and Abstracts Views on Vision4Press platform.
Data correspond to usage on the plateform after 2015. The current usage metrics is available 48-96 hours after online publication and is updated daily on week days.
Initial download of the metrics may take a while.


