Fig. 5
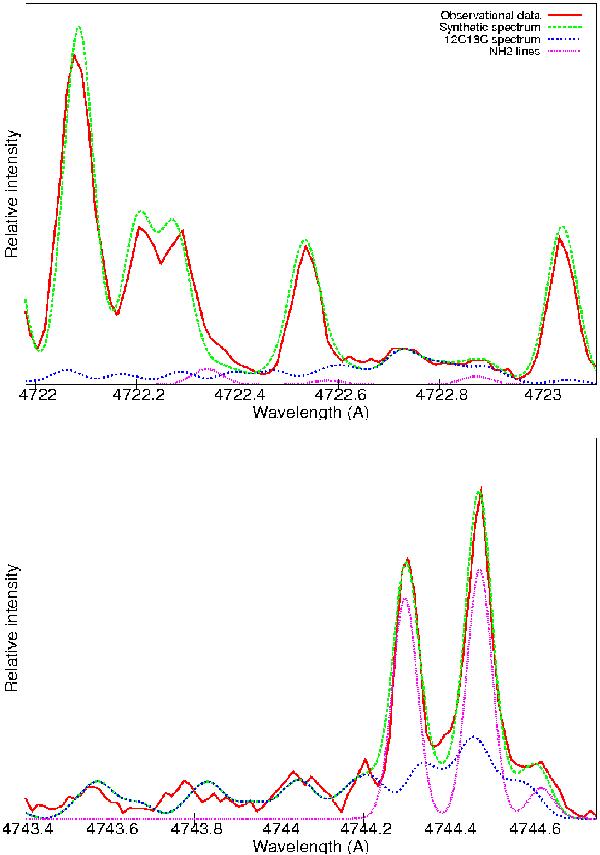
Modeling of C/2001 Q4 (NEAT) spectrum obtained on 2004 May 7 with a mixture of two different Boltzmann distributions, respectively 4200 and 600 K with proportions of 90 and 10%. The upper part represents the region around the (2,1)  band, the lower part the region around the (1,0) band. The importance of (2,1) and NH2 lines is shown by their respective spectrum. The relative brightness of NH2 lines have been adjusted to fit the observational data as well as possible.
Current usage metrics show cumulative count of Article Views (full-text article views including HTML views, PDF and ePub downloads, according to the available data) and Abstracts Views on Vision4Press platform.
Data correspond to usage on the plateform after 2015. The current usage metrics is available 48-96 hours after online publication and is updated daily on week days.
Initial download of the metrics may take a while.