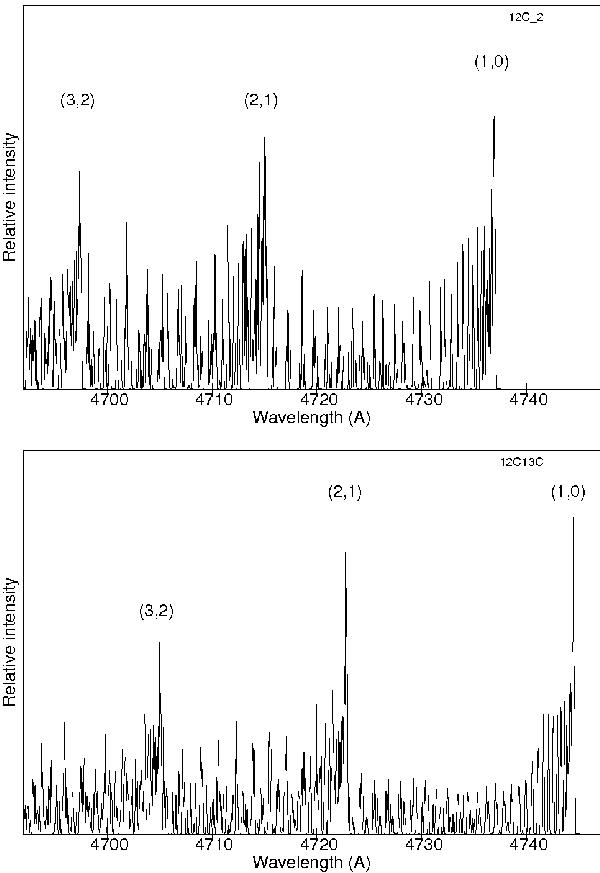
Fig. 3
Synthetic spectra of  (upper spectrum) and
  (lower spectrum) obtained using a mixture of two Boltzmann distributions with Trot = 4000 K and 600 K (90% and 10% of the molecules, respectively) and Tvib = 4500 K. The emission lines were convolved with a Gaussian instrument response function of 0.07 Å FWHM, corresponding to the spectra provided by UVES.
Current usage metrics show cumulative count of Article Views (full-text article views including HTML views, PDF and ePub downloads, according to the available data) and Abstracts Views on Vision4Press platform.
Data correspond to usage on the plateform after 2015. The current usage metrics is available 48-96 hours after online publication and is updated daily on week days.
Initial download of the metrics may take a while.