Fig. 6
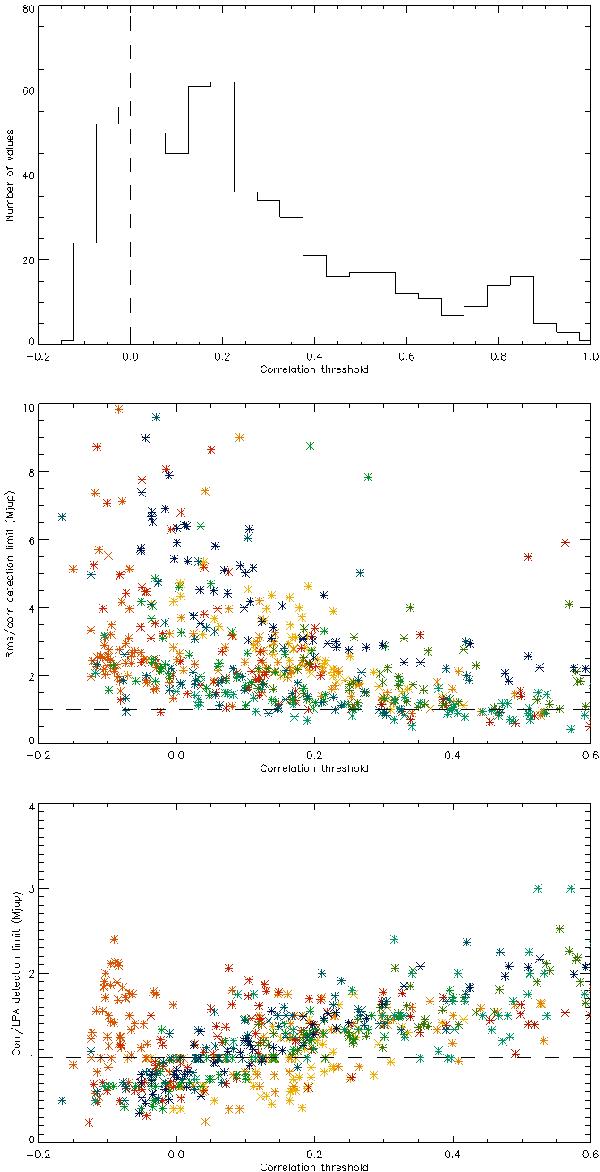
Upper panel: distribution of the correlation threshold for all stars of the sample and periods. Middle panel: ratio of the rms detection limit to the correlation-based detection limit for all stars (one color per star) and periods, versus the correlation threshold. Lower panel: ratio of the correlation-based detection limit to the LPA detection limit for all stars (one color per star) and periods, versus the correlation threshold.
Current usage metrics show cumulative count of Article Views (full-text article views including HTML views, PDF and ePub downloads, according to the available data) and Abstracts Views on Vision4Press platform.
Data correspond to usage on the plateform after 2015. The current usage metrics is available 48-96 hours after online publication and is updated daily on week days.
Initial download of the metrics may take a while.