Free Access
Fig. 4
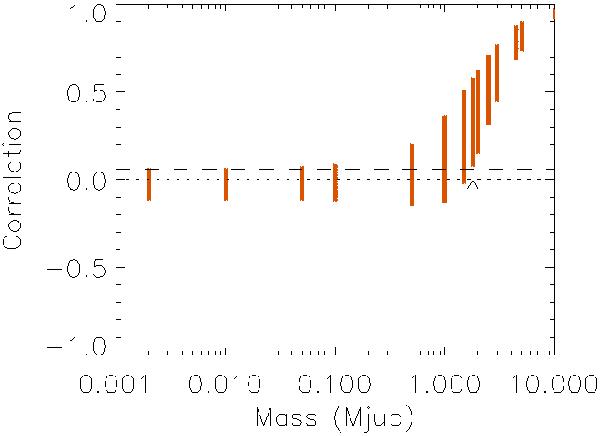
Correlation between the power of a planet RV (at P = 10 days) and the power of that planet added to the star RV, using the β Pic sampling, illustrating the correlation-based detection limit principle (see text). The dashed horizontal line indicates the threshold, and the arrow the position of the detection limit.
Current usage metrics show cumulative count of Article Views (full-text article views including HTML views, PDF and ePub downloads, according to the available data) and Abstracts Views on Vision4Press platform.
Data correspond to usage on the plateform after 2015. The current usage metrics is available 48-96 hours after online publication and is updated daily on week days.
Initial download of the metrics may take a while.