Fig. 9
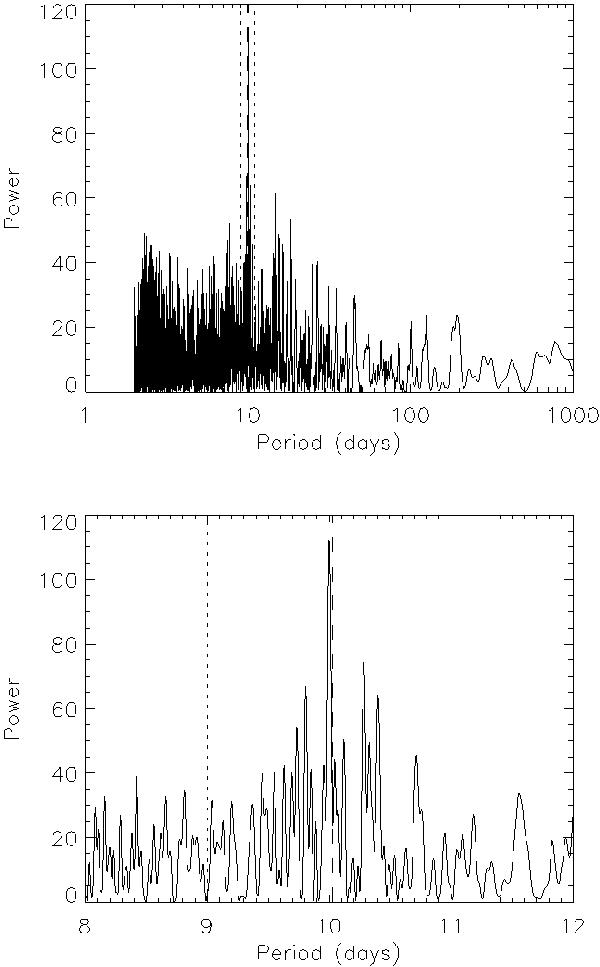
Upper panel: periodogram of the RV signal of a 10 Mjup planet of period P = 10 days for the β Pic sampling. The dotted vertical lines show the position of the exclusion period window (see text) and the dashed vertical lines the position of the planet period window (see text) used in the peak method. Lower panel: zoom for the period range 8−12 days.
Current usage metrics show cumulative count of Article Views (full-text article views including HTML views, PDF and ePub downloads, according to the available data) and Abstracts Views on Vision4Press platform.
Data correspond to usage on the plateform after 2015. The current usage metrics is available 48-96 hours after online publication and is updated daily on week days.
Initial download of the metrics may take a while.