Fig. 1
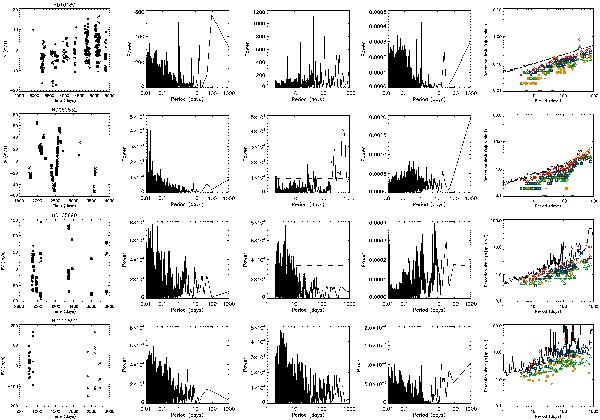
First column: RV versus time (JD–2 452 000 days) for each star of the sample. Second column: corresponding periodogram over the range 0.01−1000 days. Third column: same for the 2–1000 day range. Fourth column: periodogram of the temporal sampling. Fifth column: corresponding detection limit versus the period, for the correlation-based method (stars, orange), for the peak method (diamonds, red), for the rms method (solid line, black), for the LPA method (triangle, green), and for the bootstrap method (squares, blue).
Current usage metrics show cumulative count of Article Views (full-text article views including HTML views, PDF and ePub downloads, according to the available data) and Abstracts Views on Vision4Press platform.
Data correspond to usage on the plateform after 2015. The current usage metrics is available 48-96 hours after online publication and is updated daily on week days.
Initial download of the metrics may take a while.