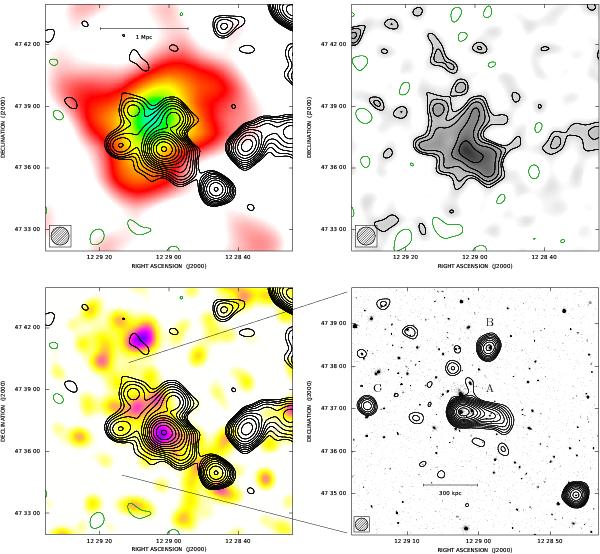
Fig. 3

Abell 1550. Top, left: total intensity radio contours of A1550 at 1.4 GHz with the VLA in D configuration. The image has a FWHM of 53′′ × 53′′. The contour levels are drawn at −0.2, 0.2 mJy/beam, and the rest are spaced at intervals of a factor of  . The sensitivity (1-σ) is 0.07 mJy/beam. Total intensity radio contours are overlaid on the Rosat PSPC X-ray image in the 0.1–2.4 keV band, taken from the RASS. The X-ray image has been convolved with a Gaussian of σ = 45′′. Top, right: total intensity radio contours and grayscale image at 1.4 GHz with the VLA in D configuration after subtraction of discrete sources. Bottom, left: total intensity radio contours of A1550 overlaid on the isodensity map of likely cluster members. Bottom, right: zoom of total intensity radio contours at the center of A1550 at 1.4 GHz with the VLA in C configuration. The image has a FWHM of 18′′ × 18′′. The first contour level is drawn at 0.15 mJy/beam, and the rest are spaced at intervals of a factor of
  . The sensitivity (1σ) is 0.04 mJy/beam. The contours of the radio intensity are overlaid on the optical image taken from the SDSS (red plate).
Current usage metrics show cumulative count of Article Views (full-text article views including HTML views, PDF and ePub downloads, according to the available data) and Abstracts Views on Vision4Press platform.
Data correspond to usage on the plateform after 2015. The current usage metrics is available 48-96 hours after online publication and is updated daily on week days.
Initial download of the metrics may take a while.


