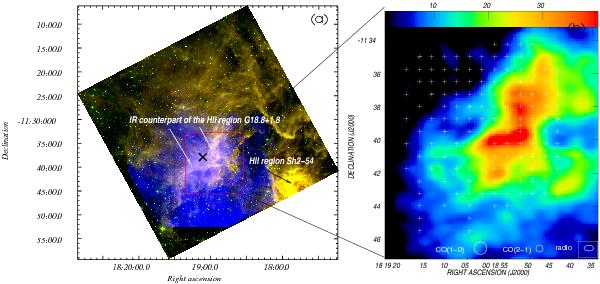
Fig. 1

Left panel: superposition of the IRAC images at 8.0 μm (red) and 5.6 μm (green) with the Hα emission (blue), of a section of the H ii region Sh2-54 including the environs of WR 113. The cross marks the position of the WR star. Right panel: VLA image at 1465 MHz showing the ionized ring. The crosses mark the positions of the 143 points observed in 12CO lines. The color scale goes from 1 to 40 mJy beam-1. The synthesized beam of the radio continuum observations and the beams of the molecular data are indicated in the bottom part of the image.
Current usage metrics show cumulative count of Article Views (full-text article views including HTML views, PDF and ePub downloads, according to the available data) and Abstracts Views on Vision4Press platform.
Data correspond to usage on the plateform after 2015. The current usage metrics is available 48-96 hours after online publication and is updated daily on week days.
Initial download of the metrics may take a while.


