Fig. 7
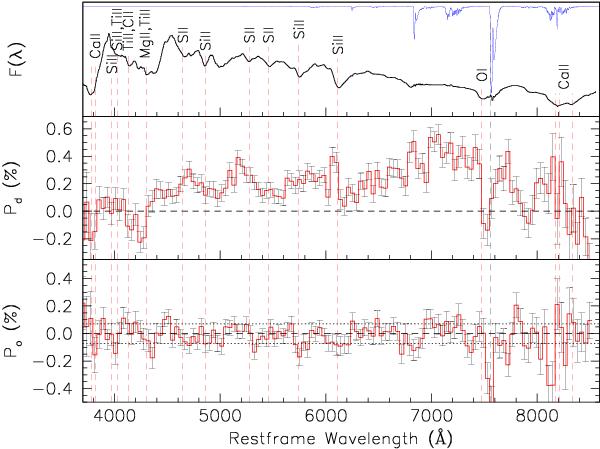
Decomposition of polarization in the combined pre-maximum data set along the dominant (central panel) and orthogonal (lower panel) axis. The upper panel shows the un-binned flux spectrum and main line identifications; the thin curve traces a synthetic telluric absorption spectrum. The horizontal dotted lines in the lower panel indicate the rms deviation from null polarization.
Current usage metrics show cumulative count of Article Views (full-text article views including HTML views, PDF and ePub downloads, according to the available data) and Abstracts Views on Vision4Press platform.
Data correspond to usage on the plateform after 2015. The current usage metrics is available 48-96 hours after online publication and is updated daily on week days.
Initial download of the metrics may take a while.