Fig. 8
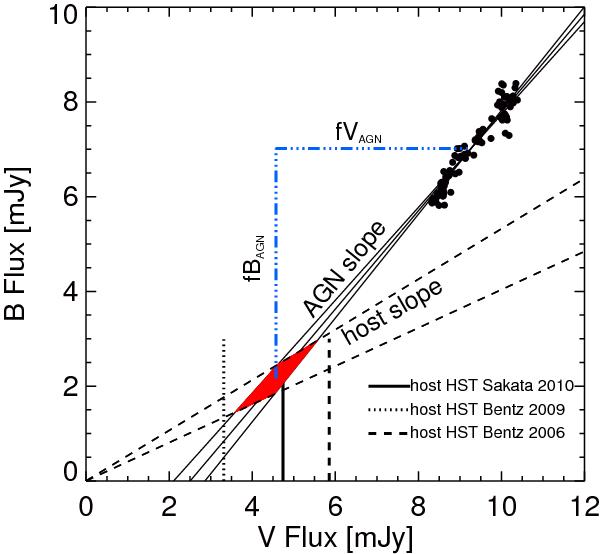
Flux variation gradient diagram of 3C 120. The solid lines delineate the bisector regression model yielding the range of the AGN slope. The dashed lines indicate the range of host slopes determined by Sakata et al. (2010) for 11 nearby AGN. The intersection between the host galaxy and AGN slope (red area) gives the host galaxy flux in both bands. The two vertical dotted and dashed lines show the host flux determined by Bentz et al. (2006) and Bentz et al. (2009a) respectively. The solid line shows the host flux obtained by Sakata et al. (2010). The dash-dotted blue lines represent the range of the AGN flux in both filters. Fluxes (black dots) were measured in a 7.5′′ aperture photometry and corrected for galactic foreground extinction.
Current usage metrics show cumulative count of Article Views (full-text article views including HTML views, PDF and ePub downloads, according to the available data) and Abstracts Views on Vision4Press platform.
Data correspond to usage on the plateform after 2015. The current usage metrics is available 48-96 hours after online publication and is updated daily on week days.
Initial download of the metrics may take a while.