Fig. 7
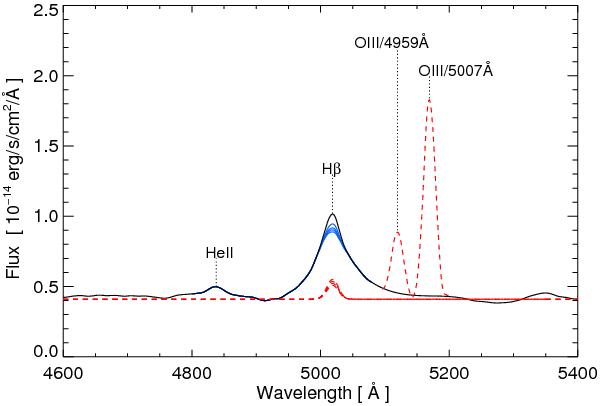
CAFOS spectrum of 3C 120, zoomed onto the Hβ line. The solid black curve represents the spectrum after subtracting the narrow [OIII]λλ4959, 5007 emission lines (red dashed lines). The four dashed red lines (at the bottom of the Hβ profile) show the narrow Hβ models, for four intensities between 7% and 10% of the [OIII]λ5007 line. The four solid blue lines represent the spectrum after subtracting the narrow Hβ models. Note that the broad faint HeIIλ4686 emission line can be clearly seen, but its possible contribution to the Hβ profile is negligible.
Current usage metrics show cumulative count of Article Views (full-text article views including HTML views, PDF and ePub downloads, according to the available data) and Abstracts Views on Vision4Press platform.
Data correspond to usage on the plateform after 2015. The current usage metrics is available 48-96 hours after online publication and is updated daily on week days.
Initial download of the metrics may take a while.