Fig. 10
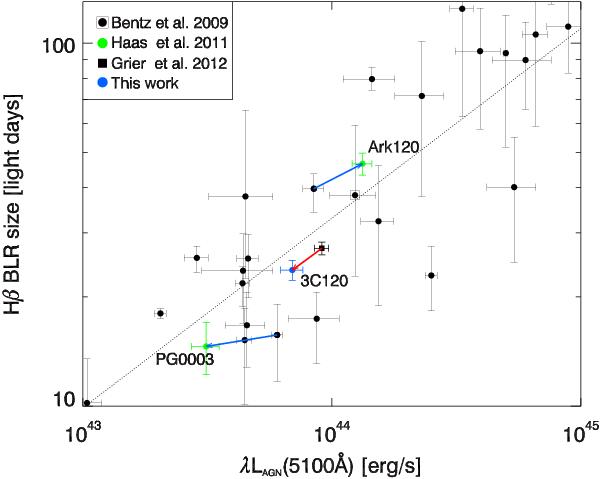
RBLR − L relationship from data of Bentz et al. (2009a) (black dots) with a fitted slope α = 0.519 (dotted line). The diagram is zoomed to contain the objects of this work (3C 120, blue dot) and Haas et al. (2011) (Ark 120 and PG 0003, green dots). The blue arrows show the positional shift of the new measurements with respect to the previous ones from Bentz et al. (2009a). The red arrow shows the shift of 3C 120 between our result and that obtained by Grier et al. (2012). The slope α of this shift is remarkably close to the theoretically expected value of α = 0.5. The original position of 3C 120 by Bentz et al. is in the center of the plot and marked by the square surrounding the fat dot.
Current usage metrics show cumulative count of Article Views (full-text article views including HTML views, PDF and ePub downloads, according to the available data) and Abstracts Views on Vision4Press platform.
Data correspond to usage on the plateform after 2015. The current usage metrics is available 48-96 hours after online publication and is updated daily on week days.
Initial download of the metrics may take a while.