Fig. 1
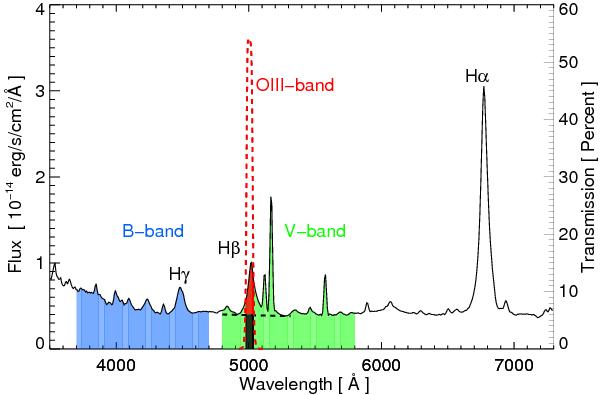
CAFOS spectrum of 3C 120 obtained on Oct. 27th 2009. For illustration, the band passes of the filters used for the photometric monitoring are shaded (blue B-band, green V-band). The transmission of the narrow band ([OIII] 5007 Å filter) is indicated by the red dotted line. While narrow band catches the redshifted Hβ line, its flux is composed of about 50% Hβ line (red shaded) and 50% the continuum (black shaded). Note that for actual flux calculations the filter curves are convolved with the transmission curve of the Alta U16 CCD camera.
Current usage metrics show cumulative count of Article Views (full-text article views including HTML views, PDF and ePub downloads, according to the available data) and Abstracts Views on Vision4Press platform.
Data correspond to usage on the plateform after 2015. The current usage metrics is available 48-96 hours after online publication and is updated daily on week days.
Initial download of the metrics may take a while.