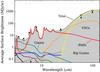
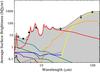
Fig. 1

Spectrum of the average surface brightness inside −65° < ℓ < 65° and −1° < b < 1° for the initial model (left) and the final modified model (right). The thick colored solid lines represent different components of the model: supergiants (purple), AGB stars (blue), giants (teal), main sequence stars (green), other stellar types (dark gray), dust emission from PAHs (red), VSGs (orange), and big dust grains (yellow), and scattered light (black). The major components are labeled in the left panel. The shaded gray area shows the total flux. The open black circles show the model fluxes after convolution with the transmission curves, and the filled black circles show the observations.
Current usage metrics show cumulative count of Article Views (full-text article views including HTML views, PDF and ePub downloads, according to the available data) and Abstracts Views on Vision4Press platform.
Data correspond to usage on the plateform after 2015. The current usage metrics is available 48-96 hours after online publication and is updated daily on week days.
Initial download of the metrics may take a while.