Fig. 2
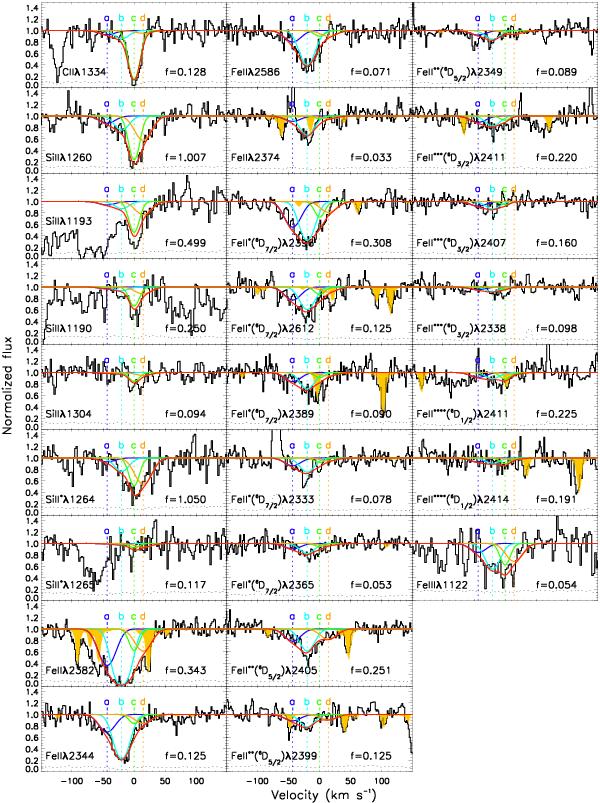
Voigt-profile fit of absorption lines observed at epoch IV. The black solid lines show the observed spectrum, with the associated error indicated by the dashed line at the bottom. The red lines show the combined model fit. Other coloured lines show the individual components. The four components, “a”, “b”, “c”, and “d”, are labelled accordingly. The transitions are listed in order of decreasing oscillator strength, for each population. Telluric features are highlighted in yellow.
Current usage metrics show cumulative count of Article Views (full-text article views including HTML views, PDF and ePub downloads, according to the available data) and Abstracts Views on Vision4Press platform.
Data correspond to usage on the plateform after 2015. The current usage metrics is available 48-96 hours after online publication and is updated daily on week days.
Initial download of the metrics may take a while.