Fig. 1
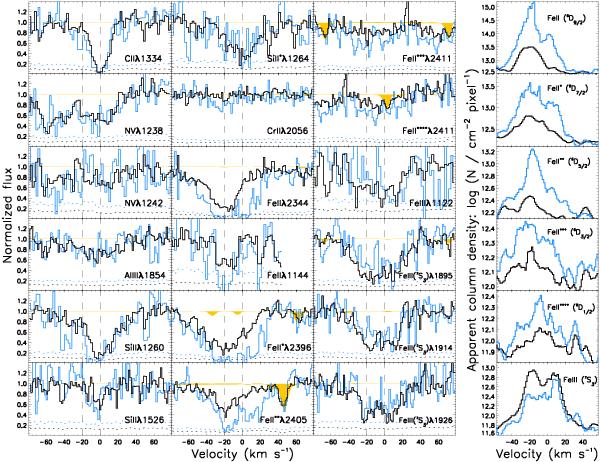
Left: a selection of line profiles observed at different epochs (epochs I and II in blue; epochs III and IV in black). Telluric features are highlighted in yellow. The dashed lines mark the position of the strongest component of all the Fe ii lines and the strongest component of Si ii, C ii and Al iii lines, respectively. Right: the apparent column-density profiles (smoothed with a boxcar of five pixels) of the Fe ii and Fe iii levels, obtained by combining together different transitions that probe a particular level, show a clear evolution with time. In particular, while all Fe ii levels depopulate, Fe iii shows the opposite trend.
Current usage metrics show cumulative count of Article Views (full-text article views including HTML views, PDF and ePub downloads, according to the available data) and Abstracts Views on Vision4Press platform.
Data correspond to usage on the plateform after 2015. The current usage metrics is available 48-96 hours after online publication and is updated daily on week days.
Initial download of the metrics may take a while.