Fig. 18
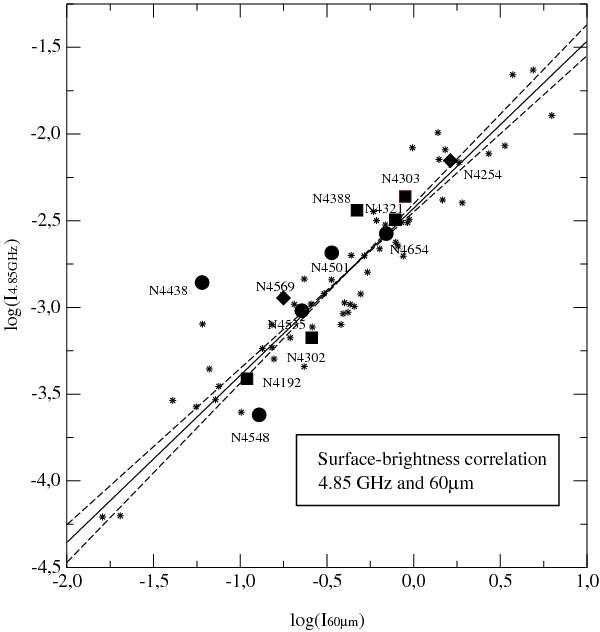
Radio – FIR diagram for our Virgo objects plotted as symbols with labels and for the reference sample of galaxies observed by Gioia et al. (1982) with an extension towards low surface-brightness objects observed by Chyży et al. (2006) – both as dots. The surface brightness at 4.85 GHz (Jy/◻′) and at 60 μm (Jy/◻′, see text) is used. The solid curve is an orthogonal fit to reference non-cluster galaxies with a slope of 0.96 ± 0.06. The dashed lines show the “regression scissors”, the maximum and minimum slopes (1.03 and 0.90) allowed by the data scatter.
Current usage metrics show cumulative count of Article Views (full-text article views including HTML views, PDF and ePub downloads, according to the available data) and Abstracts Views on Vision4Press platform.
Data correspond to usage on the plateform after 2015. The current usage metrics is available 48-96 hours after online publication and is updated daily on week days.
Initial download of the metrics may take a while.