Fig. 1
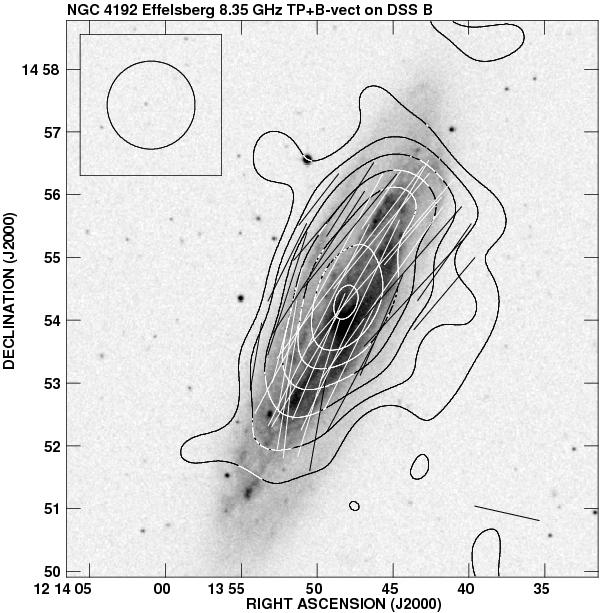
Total power map of NGC 4192 at 8.35 GHz with apparent B-vectors of
polarized intensity overlaid on the Digital Sky Survey (DSS) blue image. The
contours are 3, 5, 8, 12, 16, 20, 25 × 0.3 mJy/b.a., and a vector of 1′ length
corresponds to the polarized intensity of 0.25 mJy/b.a. The map resolution is
 . The beam size is shown in the
top left corner of the figure.
. The beam size is shown in the
top left corner of the figure.
Current usage metrics show cumulative count of Article Views (full-text article views including HTML views, PDF and ePub downloads, according to the available data) and Abstracts Views on Vision4Press platform.
Data correspond to usage on the plateform after 2015. The current usage metrics is available 48-96 hours after online publication and is updated daily on week days.
Initial download of the metrics may take a while.