Free Access
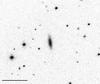
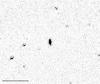
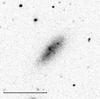
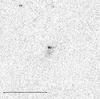
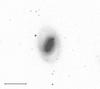
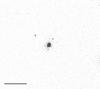
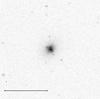
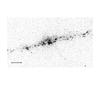
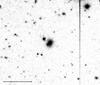
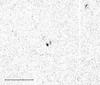
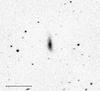
Fig. B.2
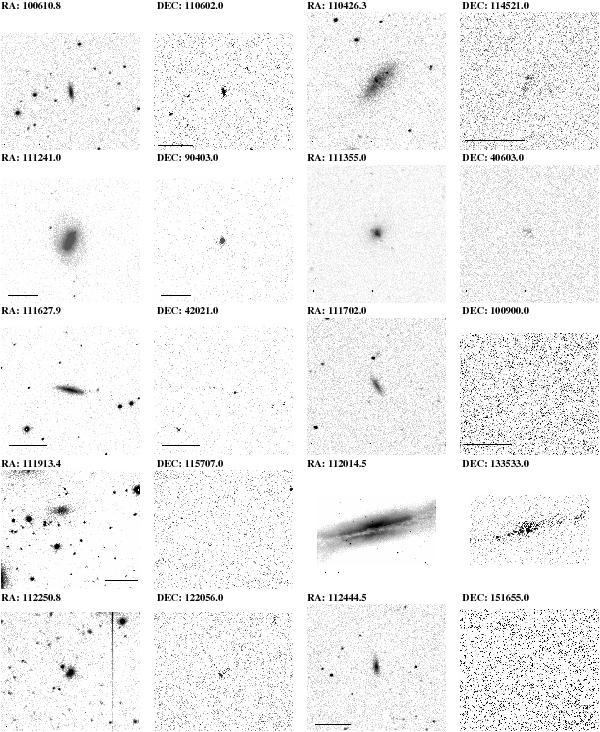
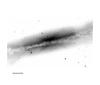
Atlas of 84 marginal detections (<2σ) or with complex unresolved Hα emission, identified by their celestial coordinates (2 objects per line). The OFF-band (left panel), the NET frame (right panel) are given. A 1 arcmin bar is given on all images
This figure is made of several images, please see below:
Current usage metrics show cumulative count of Article Views (full-text article views including HTML views, PDF and ePub downloads, according to the available data) and Abstracts Views on Vision4Press platform.
Data correspond to usage on the plateform after 2015. The current usage metrics is available 48-96 hours after online publication and is updated daily on week days.
Initial download of the metrics may take a while.