Fig. 7
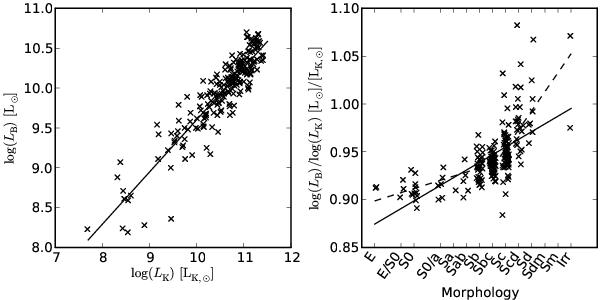
Luminosities of the AMIGA isolated galaxies that are in the SDSS complete sample and have available NIR luminosities (n = 211). The left panel shows the relation between LB and LK. The ordinary least-squares (OLS) regression line is shown as a solid black line. The right panel shows the relation of log (LB)/log (LK) with the morphology. The OLS regression for the whole sample is plotted as a solid line. Two additional OLS regression lines are shown as dashed lines, the first for galaxies with morphological types between E and Sbc and the second for the rest. A small random scatter (from −0.25 to 0.25 of a class) was added to the morphology values to allow a proper visualisation of the symbols.
Current usage metrics show cumulative count of Article Views (full-text article views including HTML views, PDF and ePub downloads, according to the available data) and Abstracts Views on Vision4Press platform.
Data correspond to usage on the plateform after 2015. The current usage metrics is available 48-96 hours after online publication and is updated daily on week days.
Initial download of the metrics may take a while.