Fig. 5
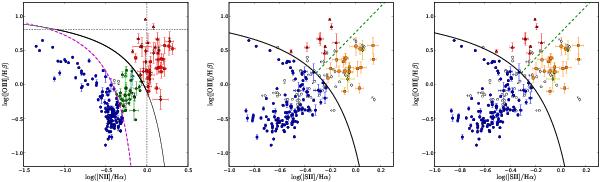
Emission line diagnostic diagrams. Error bars have been plotted, and an arrow added for upper or lower limits. Left panel: [N ii] diagnostic diagram. The shape of the marker indicates the final classification of nuclear activity: circle – SFN; pentagon – TO; triangle – Sy2; square – LINER, diamond – NLAGN. Filled markers correspond to galaxies classified using this diagnostic diagram, and the colour indicates the derived classification: red – AGN; green – TO; blue – SFN; cyan – TO or SFN; light green – TO or AGN. See Sect. 3 for a complete description of the classification scheme. Middle panel: [S ii] diagnostic diagram. The AGN-SFN separation curve of Kewley et al. (2001) is shown as a black solid line and the Sy2-LINER separation line of Kewley et al. (2006) as a green dashed line. Symbol shapes are the same as in the [N ii] diagram and the colours indicate the classification obtained with this diagram: red – Sy2; yellow – NLAGN; orange – LINER; and blue – SFN. Right panel: [O i] diagnostic diagram. Symbol shapes are the same as in the [N ii] diagram. Colours and separation curves are the same as in the [S ii] diagram. Empty symbols correspond to galaxies that cannot be unambiguously classified using this diagram but that were eventually classified using the other diagrams (see text).
Current usage metrics show cumulative count of Article Views (full-text article views including HTML views, PDF and ePub downloads, according to the available data) and Abstracts Views on Vision4Press platform.
Data correspond to usage on the plateform after 2015. The current usage metrics is available 48-96 hours after online publication and is updated daily on week days.
Initial download of the metrics may take a while.