Fig. 10
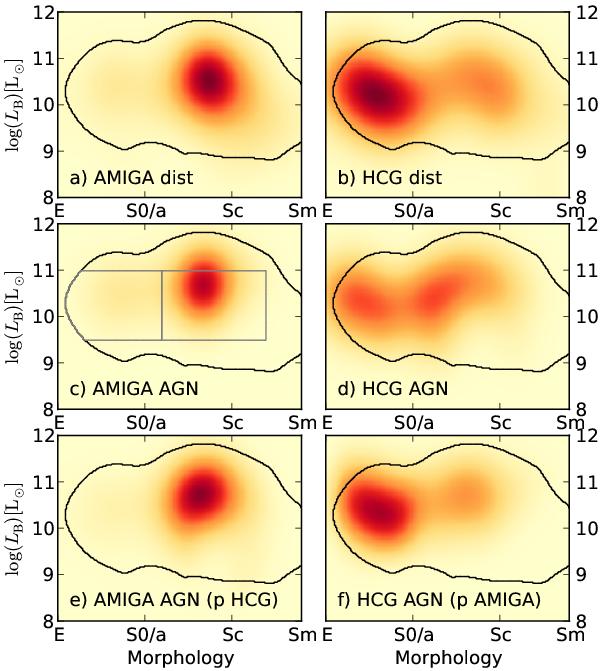
Distribution of galaxies (morphology and optical luminosity) and comparison of the actual and estimated distribution of AGN in the AMIGA and HCG samples. In the top panels the total distribution of galaxies for the AMIGA a) and HCG b) samples are shown. The colour ranges from red to yellow, with red corresponding to a higher density of galaxies. In the middle panels the distributions of AGN in the AMIGA c) and HCG d) are shown. In the lower panels, the cross-estimated distributions of AGN in AMIGA e) and HCG f) are shown, as produced by combining the actual distribution of galaxies with the probability of harbouring an AGN determined from the other sample. The colour scale of the middle and lower panels is one third of the scale of the corresponding upper panel. The black contour marks the region in common between both samples (95.45% of the galaxies inside the contour for each sample) and the rectangles shown in the panel “c” denote the bins chosen for the χ2 test.
Current usage metrics show cumulative count of Article Views (full-text article views including HTML views, PDF and ePub downloads, according to the available data) and Abstracts Views on Vision4Press platform.
Data correspond to usage on the plateform after 2015. The current usage metrics is available 48-96 hours after online publication and is updated daily on week days.
Initial download of the metrics may take a while.