Fig. 3
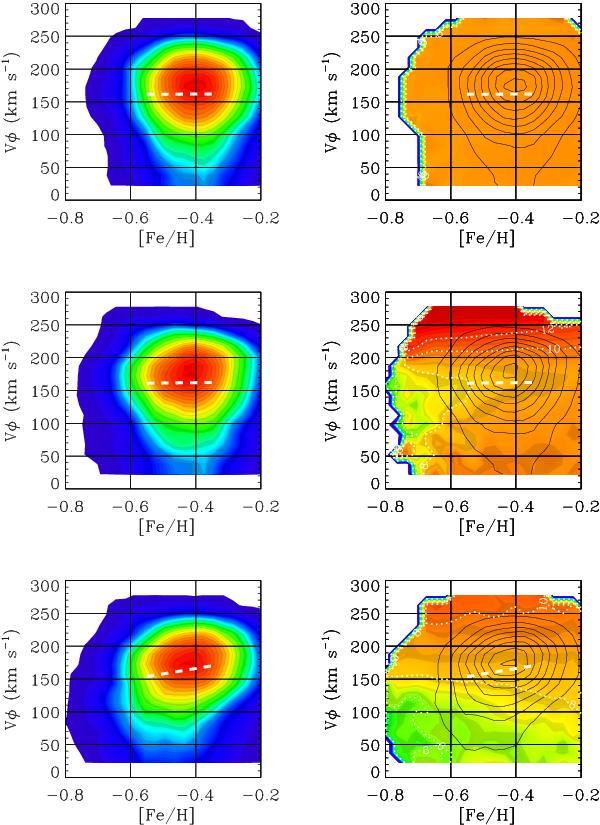
Barred-disk model. Distribution of the azimuthal velocity and metallicity after an evolution of 0, 0.1, 0.4 Gyr. Left panels: colour contour plot showing the rotation-metallicity distribution, Vφ vs. [Fe/H], of the particles in the solar annulus, 8 kpc < R < 10 kpc and 1.5 kpc < | z | < 2.0 kpc. The dashed white line indicates the linear fit in the central region of the distribution, including all particles with −0.55 < [Fe/H] < − 0.35 and Vφ > 50 km s-1. Right panels: the colour contour plot represents the distribution of the mean original radius, ⟨ R0 ⟩ , as a function of ([Fe/H],Vφ) of the same particles shown in the left plot. Here, the dotted white lines mark the iso-contours at ⟨ R0 ⟩ = 6 kpc, 8 kpc, 10 kpc, and 12 kpc. The black contours indicate the iso-density levels of the ([Fe/H],Vφ) distribution shown in the left panel.
Current usage metrics show cumulative count of Article Views (full-text article views including HTML views, PDF and ePub downloads, according to the available data) and Abstracts Views on Vision4Press platform.
Data correspond to usage on the plateform after 2015. The current usage metrics is available 48-96 hours after online publication and is updated daily on week days.
Initial download of the metrics may take a while.